The Task
To join the ATLAS collaboration, every new member is required to work on a qualification task. These are usually tasks that involve working closely on the experiment, the ATLAS detector or the experiments software framework. My task was the development of a standalone version of the event display VP1. An event display in particle physics is an application that visualizes the physics that happens in the particle detector. The ATLAS experiment is one of the big, multi-purpose experiments located on the LHC, the Large Hadron Collider at CERN. At the LHC, protons are colliding at different interaction points, each one hosting a different experiment. The ATLAS detector measures the vast number of particles created from the colliding protons. VP1 visualizes these collisions, displaying all the different particles, interaction points and other physics objects.
My task was to extract the visualization software that is integrated into into the ATLAS software framework and make it a standalone application that physicists can use on their personal computers. The ATLAS software framework only runs on a very limited selection of operating systems, namely Scientific Linux or CentOS. This was a great obstacle for many physicists who wanted to visualize their analysis data on their personal computers, running either macOS or a more common Linux distribution like Ubuntu.
The Visualization
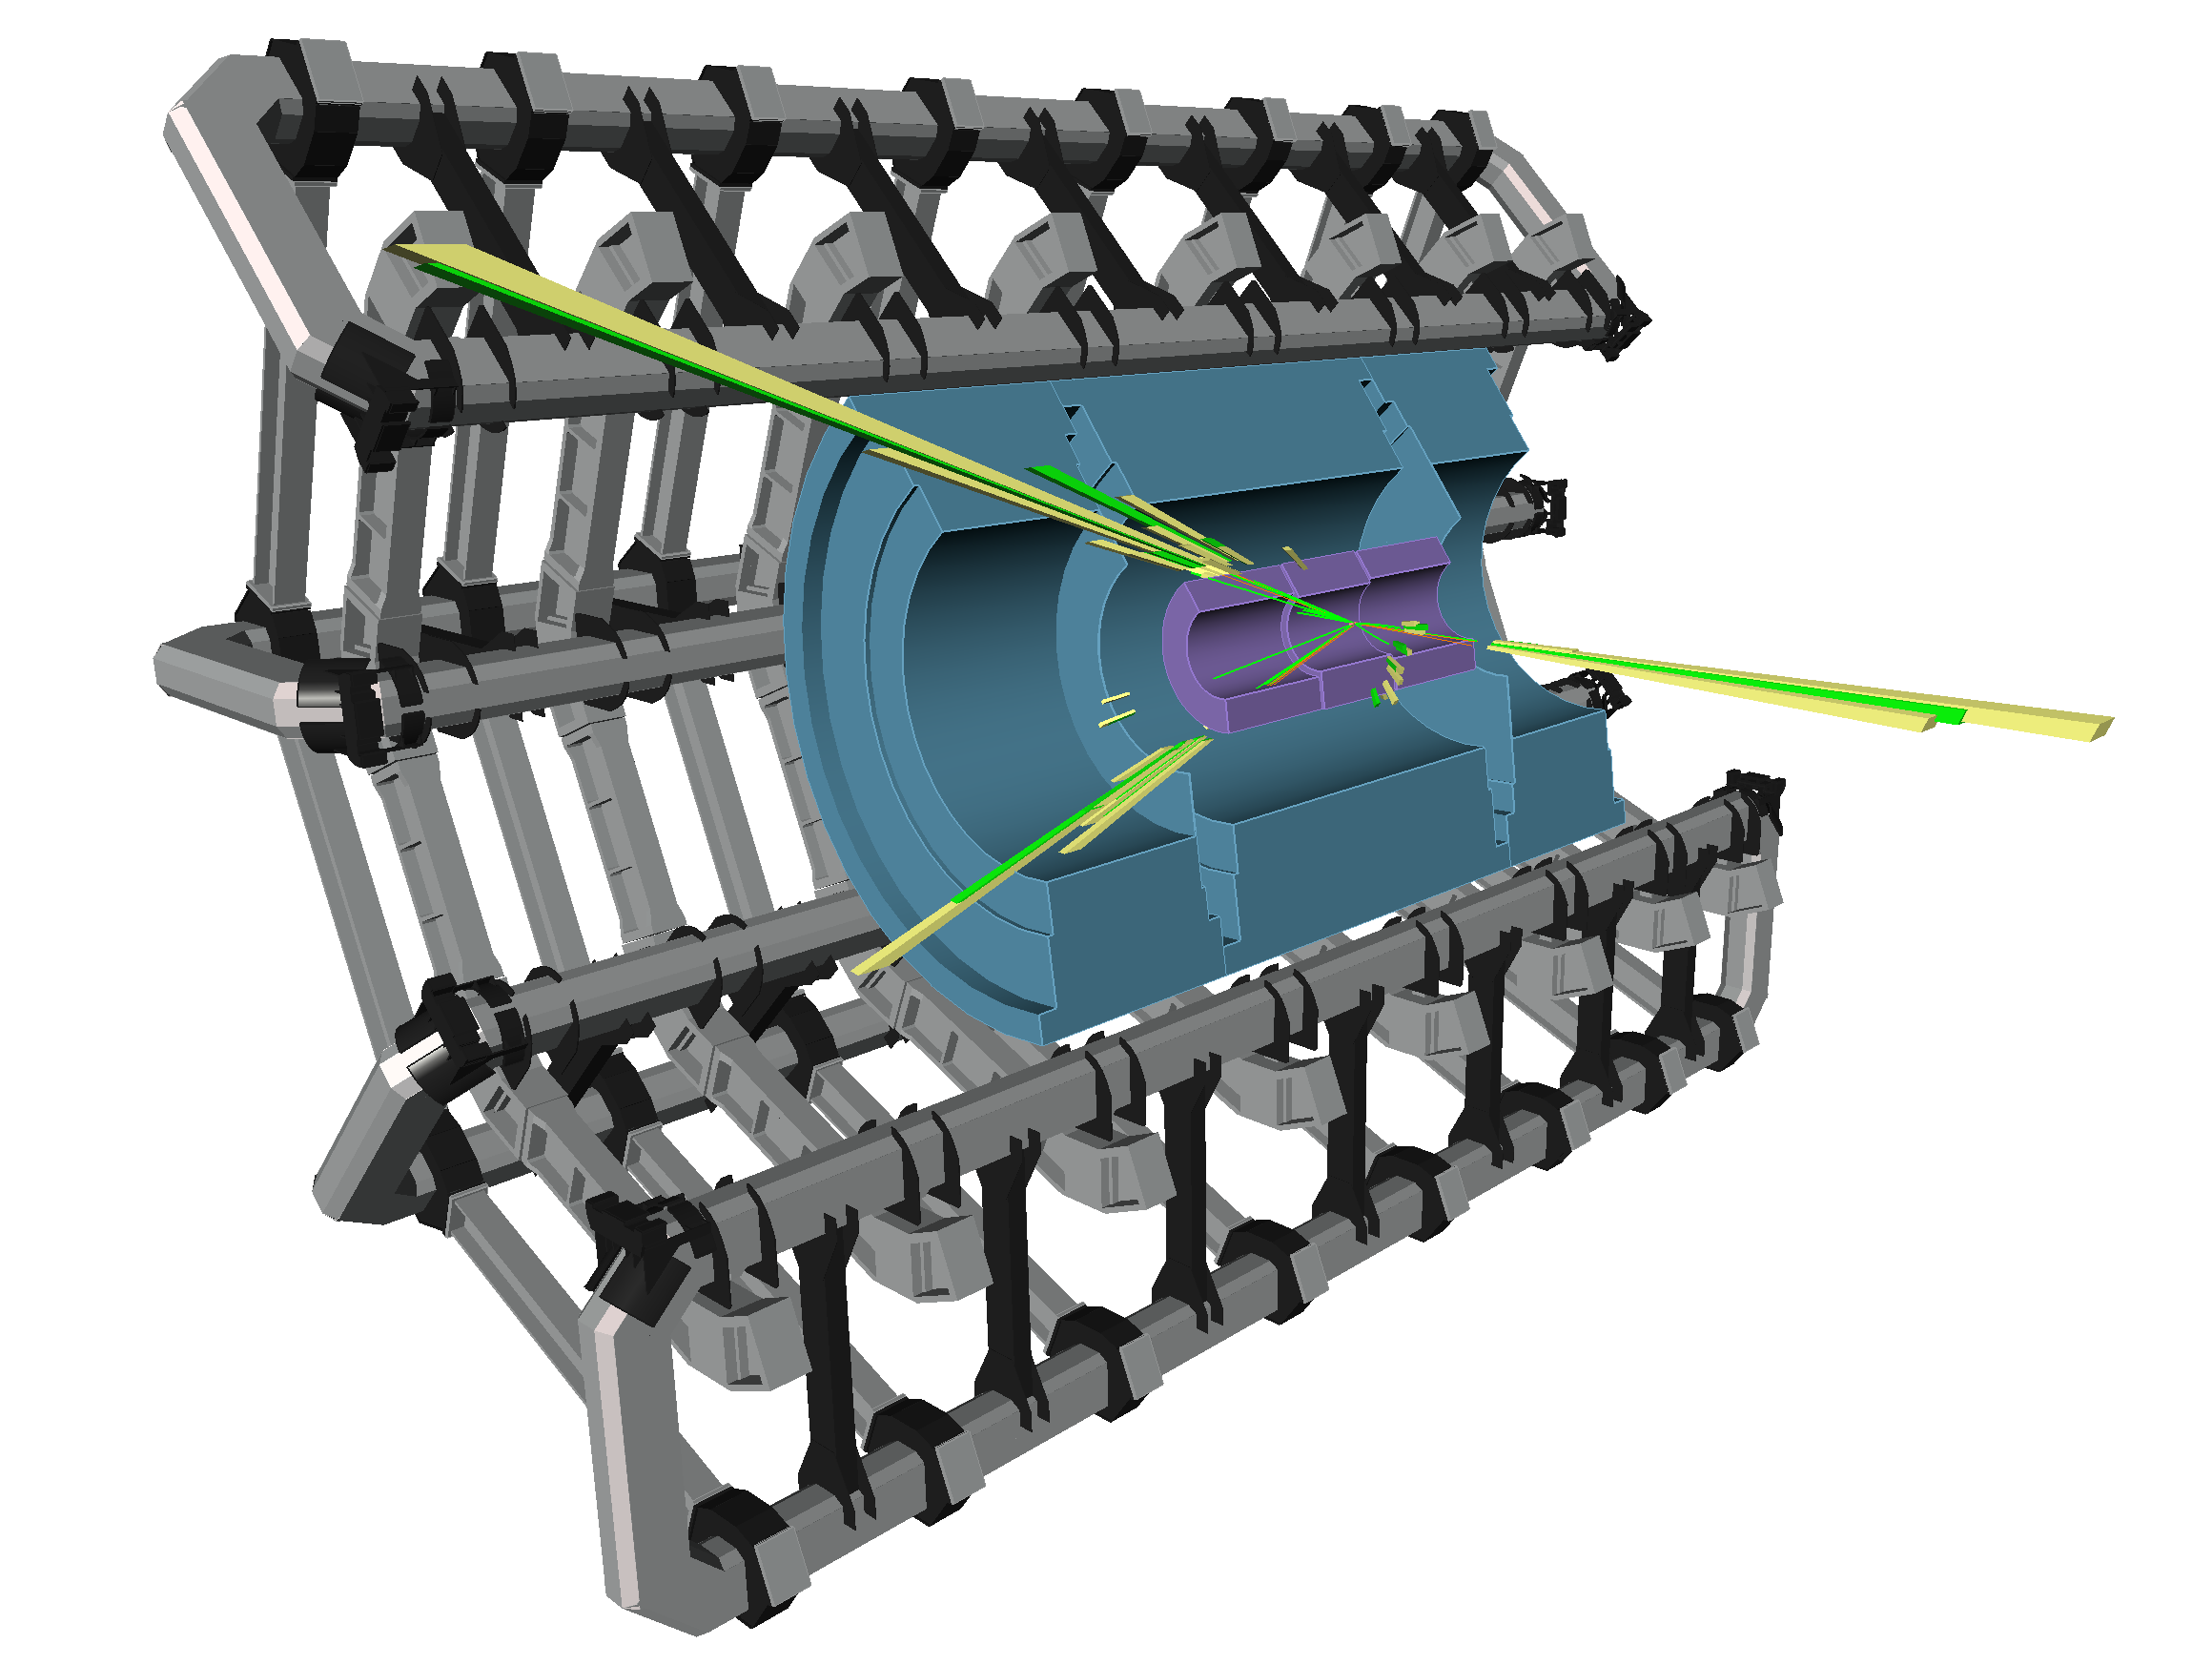
In the image above you can see a collision event where the two colliding protons created two top quarks that subsequently decayed into high energetic particle jets. Parts of the inner detector (purple), the calorimeters (blue) and the toroid magnets (gray) can also be seen. The whole image is a cut-out of the cylindrically shaped detector to give a perspective of the physics that’s happening on inside. The physics objects that are displayed are electrons (green lines) and other charged particles (orange lines) in the inner tracker. The tracker is the inner most part of the detector. It measures the bending tracks of the charged particles as they travel through the magnetic field. The green and yellow bars extending farther to the outside represent energy deposits in the calorimeter. The calorimeter measures the energy of the particles by absorbing most of the produced particles.
Check out the CHEP 2018 proceedings to get some details on the newest developments in ATLAS standalone
Also check out the ATLAS VP1 homepage for more info and news on VP1, the full event display and a full gallery of event displays.